


I learned the importance of metrics and predictive analysis from an unlikely source in an odd place — the McDonald’s near my college — yes, the place with the golden arches! When I started working there, I didn’t know about Ray Kroc or his revolutionary idea about portion control. I simply wanted to earn money to cover my car and insurance payments.
Everything was measured at this store, from how long the fries were blanched to how long burgers were grilled to the amount time food was allowed to wait in the warming area. In addition to the process measurements, the store’s managers and assistant managers were responsible for recording the day, the date, the weather, special events within a ten mile radius, hourly sales from each register, hourly numbers for each item sold, and amount of items sent to waste each hour.
After three months of working the register, I was promoted to assistant manager and discovered the rationale behind all of the recordkeeping at the store. We had timers set for every step of the French fry preparation due to a taste study conducted some years earlier. Our great tasting fries were the result of a highly researched and test process that was optimized at every step. The proof of that was even people from nearby towns visited our store just to get an order of fries, sometimes two or three.
All of the weather, event, items, and sales recordkeeping was designed to help the managers and their assistants perform the function of “calling the bin.” It was each manager and assistant manager’s responsibility to review the previous three years’ records for that day, the previous day, and the subsequent day at the beginning of a shift. The purpose of this activity enabled a more accurate “calling of the bin.” Accuracy was crucial as fifty percent of the performance rating for managers and assistant managers was based upon their ability to “call the bin” accurately and keep hourly waste to less than five percent of hourly sales. Managers who could interpolate the past data and make good predictions based upon their research received better ratings and raises.
My introduction to measured and managed processes and prediction analysis was as practical as it was illuminating. It’s been difficult over the years to understand why enterprises neglect these significant components of process management.
Building a Roadmap
You can’t build a roadmap if you don’t know your starting point or where you want to go. Did McDonald’s map its processes? Yes, there were descriptions and diagrams in a binder that was available to every employee in the store.
Countless business managers believe that, when it comes to process management, comprehension of the present state is unnecessary. The reasons for avoiding evaluation of process current states are as numerous as they are inventive.
“Let’s just change/fix them.”
“It’s a waste of time that’s better spent elsewhere.”
“We already have SOX §404 documentation; we don’t need anything more.”
“No one will look at these documents once they’re completed. Further there is no one to keep them updated!”
Do any of these sound familiar?
Until every participant understands the current state of a process, improvement, let alone any measurement, cannot begin. Mapping the current state of a process enables measurement of each component. Once metrics can be associated with the elements of a process, participants can evaluate which actions or improvements are most likely to result in a better process with superior results.
Mapping Format Matters
Does the format matter? The simple answer is: Yes, it can. The more critical question to ask is: What do we want or need to measure in this process? Here are some examples.
- Duration of each step
- Number “hand offs” in the process
- Number or amount of required inputs or outputs
- Number of participants
- Amount of key controls
Different process mapping formats uncover different challenges. There doesn’t appear to be a single format that allows participants to see all of the process metrics at once.
Linear Diagrams
Linear process diagrams, also known as “time line” diagrams, display the chronological order of events in a process. A linear flow of events and tasks can also assist participants in a process with identification and measurement of areas where duration is excessive.

Figure 1: Linear Diagram
If an organization wants to reduce its period close cycle from five to two days, a linear diagram can help identify “time lags” in the close process.
Cross-Functional (swim lane) Diagrams
Cross-functional diagrams help participants with understanding the relationships between functions and entities. Process participants can easily review and measure “hand offs” and “decision points” and gain some insight into “moments of truth.” However, cross-functional process diagrams provide little insight regarding duration, as well as inputs and outputs.
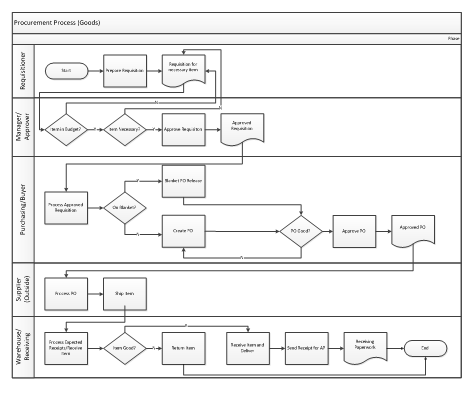
Figure 2: Cross Functional Diagram
If an organization wants to evaluate the key controls in a process, cross-functional diagrams provide a quick means for visually identifying controls.
SIPOC (Suppliers, Inputs, Process, Outputs, and Customers) Diagrams
This approach to process mapping provides a rounded view, i.e. inputs, outputs, tasks, suppliers, and customers, including a decent picture of “moments of truth.” It is typically more verbal, rather than graphical, and can be a very useful summary or recap of a more involved process narrative document.

Figure 3: SIPOC diagram example
As such, it is quite useful as a supplement to the graphical mapping tools described above. However, SIPOC charts do not afford much insight regarding chronological or functional flow. They also do not include much information about cross-functional relationships and dependencies.
“In God we trust, all others bring data.”[i]
Measurement and management may commence only when processes are mapped, steps and sub-processes are defined, and all of the participants have a grasp of the “big picture.”
Metrics, i.e. data, are the foundation of process improvement and determining the ROI of such efforts. As elements of a process are measured with quantifiable data, actions can be taken to improve and, potentially optimize that process over time.
Were processes reviewed and improved at McDonald’s? They were. For example, the company began experimenting with frozen fries in the mid-1960’s; however, it wasn’t until the early 1980’s that all McDonald’s stores, both corporate and franchise-owned, used frozen fries with a new process for blanching and frying that produced French fries that customers wanted.
Summary
Every activity in business involves a process. To innovate with processes, it is necessary to understand them thoroughly. Processes that are mapped and understood can be evaluated and the components can be measured.
Only measured processes can be effectively managed, continually improved, and creatively innovated.


0 comments:
Post a Comment