Business Process Management Key Process Indicators are used to monitor the business performance of an organization. However, are we selecting, tracking, and making the best decisions relative to organizational KPIs? I say that often there are problems with the traditional approaches. Described next are some issues with traditional approaches, along with resolution.
Business Process Management Key Process Indicators Tracking
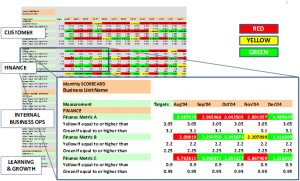
Often business process management key process indicators tracking is accomplished using stoplight scorecards.
From Table 2.5 from The Integrated Enterprise Excellence: An Enhanced, Unified Approach to Balanced Scorecards, Strategic Planning, and Business Improvement, Copyright 2008
With this red-yellow-green performance tracking approach, a red color indicates that a metric is not meeting its goals, while green provides the statement that everything is operating satisfactory at some point in time. Process owners who have metrics that are red in color are to be working to bring their scorecard reporting back to green. When a metric transitions from red to green, organizations may ?bring out the champagne?; however, often this celebration is not warranted and the color can quickly change back to red.
Processes typically have variability, where regular up and down process variation may be large enough to encompass the targeted objectives. If this were the case, a process could transition from red to green regularly when nothing has changed in the process. This form of tracking can lead to much non-productive firefighting and/or playing games with the numbers.
Organizations benefit when there are predictive scorecards that get organizations out of the firefighting mode. This figure below shows how a red-yellow-green scorecard indicated that there were many transitions; however, the alternative 30,000-foot-level reporting format indicates nothing changed over time and that there is about 33% common-cause non-compliance rate. Whenever we have more common-cause variability that is unacceptable then a change needs to be made to the process.
From Figure 6.2 from The Integrated Enterprise Excellence: An Enhanced, Unified Approach to Balanced Scorecards, Strategic Planning, and Business Improvement, Copyright 2008
Business Process Management Key Process Indicators Metric Determination
The question of whether we are tracking the most important metrics needs to also be addressed when evaluating business process management key process indicators. Often these metrics are not determined as part of an integral evaluation of what is done in the organization and how the functions are to be tracked relative to quality, cost, and time.
An Integrated Enterprise Excellence (IEE) value chain provides guidance for the selection of business process management key process indicators (KPIs). Where the IEE value chain describes what an organization does and how it measures its performance.
Process Indicators Improvement
Organizations benefit when they use a roadmap for business process management key process indicators improvement. The IEE roadmap for implementing Business Process Management (BPM) provides this direction.
The analysis steps in both executing BPM and Enterprise Process Management (EPM) in this IEE system can provide valuable guidance for what should be done using data analyses and business knowledge so that business decisions support the enterprise as a whole relative to day-to-day work and whole-system benefits.
Analyses of predictive measure performance hypotheses can give guidance to what could be done to improvement the metrics as part of the IEE roadmap. The IEE roadmap provides guidance for what might be done to implement improvements that can positively impact business process management key process indicators.
Key Process Indicators Book
A business process management key process indicators book provides the roadmap for the selection, predictive tracking, and improvement so that the enterprise as a whole benefits.


